[North America] AQmap — displays hourly average fine particulate matter (PM2.5) concentrations for Canada and the northern United States. The website is supported by the University of Northern British Columbia (UNBC) and Environment and Climate Change Canada (ECCC). Works best using a desktop or laptop computer.
[North America] AirNow Fire and Smoke Map — provides information about concentrations of fine particulate matter (PM2.5) from wildfire smoke in North America.
[North America] PurpleAir Real-time Map — provides real-time information about concentrations of fine particulate matter (PM2.5) in North America. By default, the map displays the Air Quality Index (AQI) based on PM2.5 fine particulate matter, created by the United States Environmental Protection Agency (US EPA). You may select other air quality indexes, including the Canadian Air Quality Health Index (AQHI).
[North America / International] IQAir — Air quality in Canada — information about the air quality index (AQI) and concentrations of fine particulate matter (PM2.5) in cities around the world.
[North America] Air Quality Model Forecast Maps — the air quality model forecast maps are generated twice a day by Environment and Climate Change Canada.
[North America] Raven Clean Air Map — provides information about concentrations of carbon dioxide at various locations.
[Ontario] Air Quality Ontario — a map displays the Air Quality Health Index (AQHI) for stations in Ontario. Readings are updated every hour.
[Québec] Réseau de surveillance de la qualité de l’air du Québec (in French) — the current network includes sixty stations.
[Montréal] Montréal: Air quality — The city’s air quality surveillance network publishes data in an interactive map (in French).
[Boston] Boston Public Schools Indoor Air Quality — Boston Public Schools has installed indoor air quality sensors in all classrooms in schools. The sensors report information in real time on key measures of air quality, including concentrations of carbon dioxide, carbon monoxide, and fine particulate matter (PM2.5 and PM10).
[International] IQAir — information about the air quality index (AQI) and concentrations of fine particulate matter (PM2.5) in cities around the world.
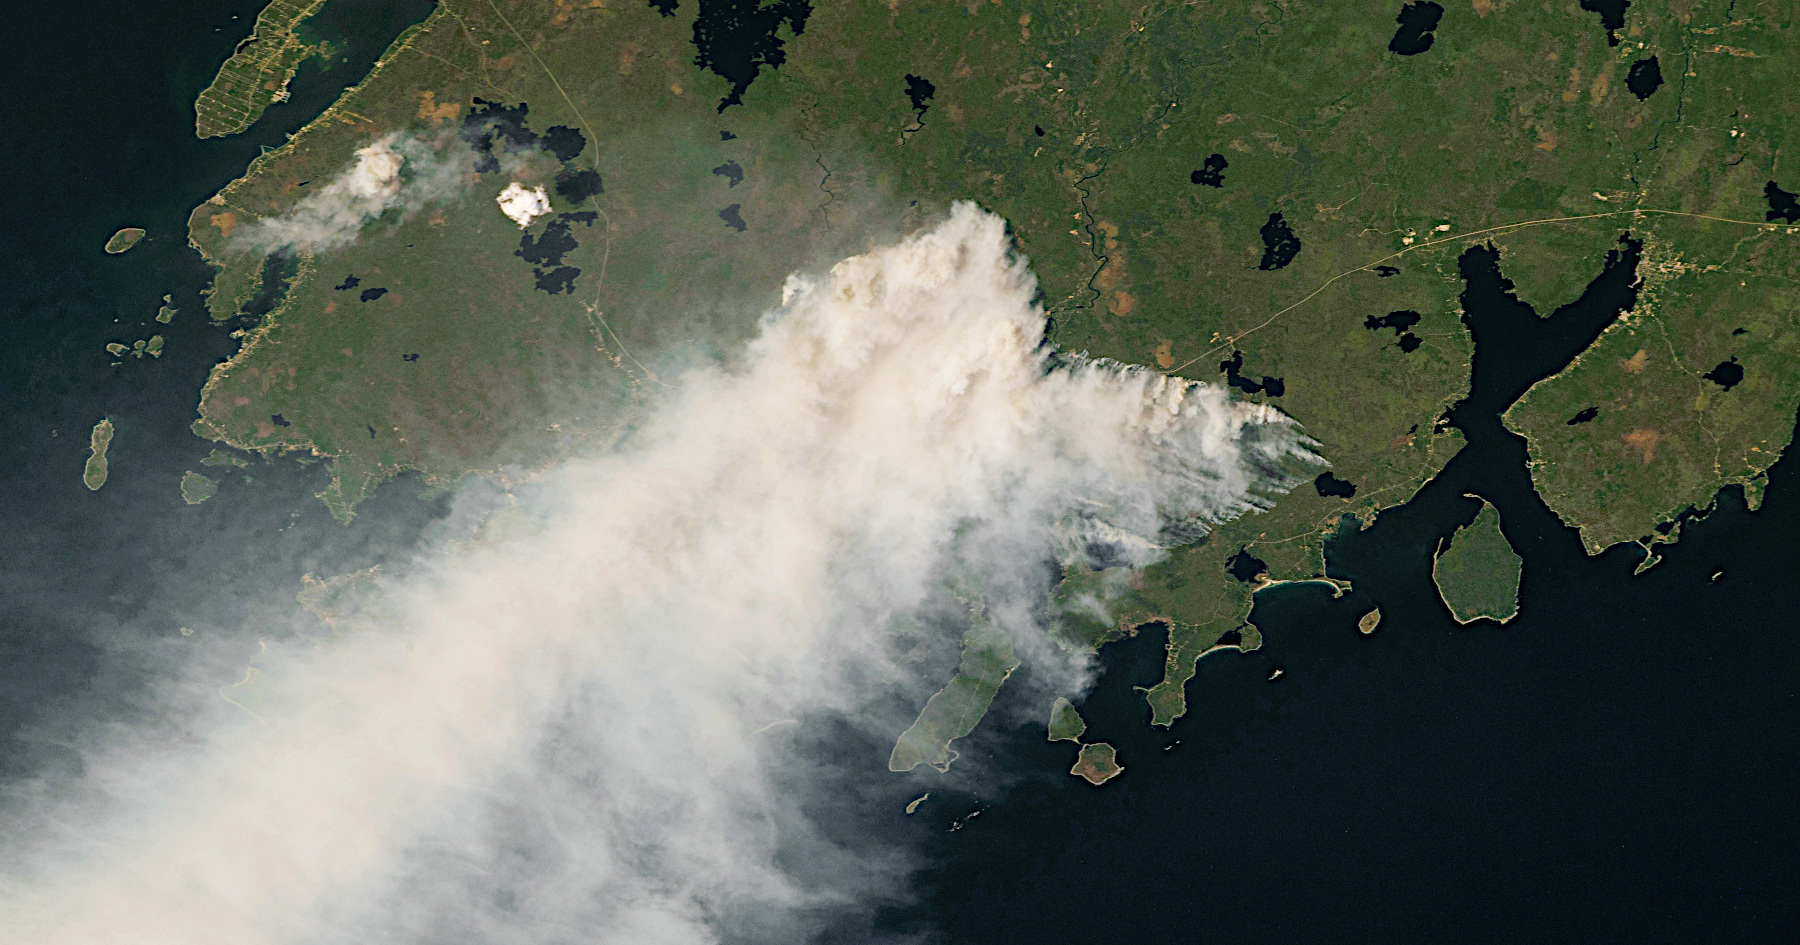
Image description: Forest fires near Shelburne, Nova Scotia, on May 29, 2023. Photo: NASA Earth Observatory image. Photo was taken by astronauts aboard the International Space Station.

